dcoker-compose安装prometheus+grafana
docker-compose.yaml
1
2
3
4
5
6
7
8
9
10
11
12
13
14
15
16
17
18
19
20
21
22
23
24
25
26
27
28
29
30
31
32
33
34
35
36
37
38
39
40
41
42
43
44
45
| version: '3'
services:
centos1:
image: centos
container_name: centos1
restart: always
ports:
- "9101:9100"
volumes:
- ./node_exporter:/root
command: /root/node_exporter
centos2:
image: centos
container_name: centos2
restart: always
ports:
- "9102:9100"
volumes:
- ./node_exporter:/root
command: /root/node_exporter
prometheus:
image: prom/prometheus
container_name: prometheus
user: root
restart: always
ports:
- "9099:9090"
volumes:
- ./prometheus:/etc/prometheus
- ./prometheus_data:/prometheus
command:
- '--config.file=/etc/prometheus/prometheus.yml'
- '--storage.tsdb.path=/prometheus'
grafana:
image: grafana/grafana
container_name: grafana
restart: always
user: root
ports:
- "3000:3000"
volumes:
- ./grafana_data:/var/lib/grafana
|
下载node_explorer https://prometheus.io/download/#node_exporter
prometheus/prometheus.yml
1
2
3
4
5
6
7
8
9
10
11
12
| global:
scrape_interval: 5s
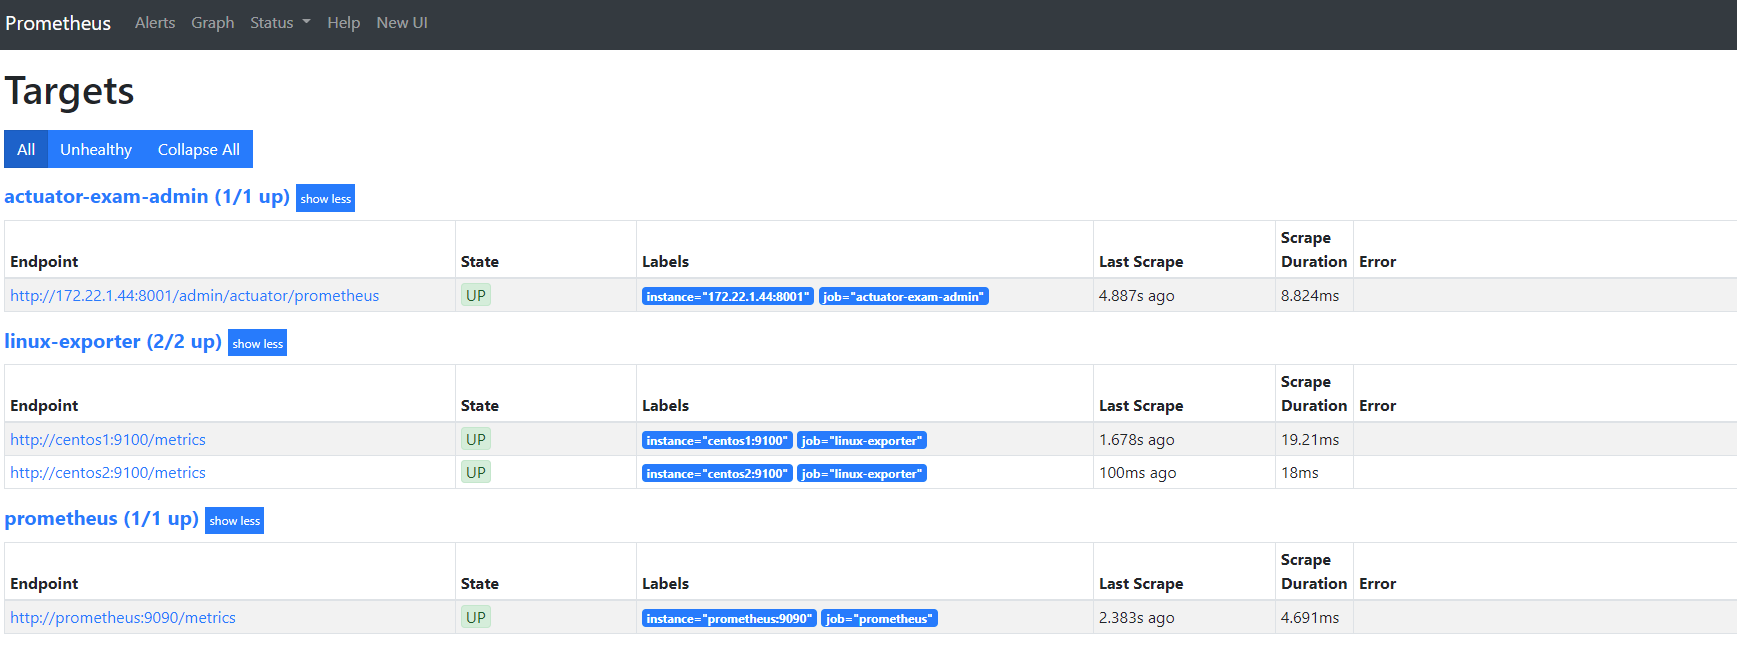
scrape_configs:
- job_name: 'prometheus'
static_configs:
- targets: ['prometheus:9090']
- job_name: 'linux-exporter'
metrics_path: /metrics
static_configs:
- targets: ['centos1:9100', 'centos2:9100']
|
启动之后可能发现如下两个错误
- prometheus权限问题
加上user: root即可解决
参考stacoverflow
[github issue 描述] https://github.com/prometheus/prometheus/issues/5976
- grafana权限问题
报错如下1
| mkdir: cannot create directory ‘/var/lib/grafana/plugins‘: Permission denied
|
grafana_data目录权限,即可解决
grafana初始用户名密码都是admin
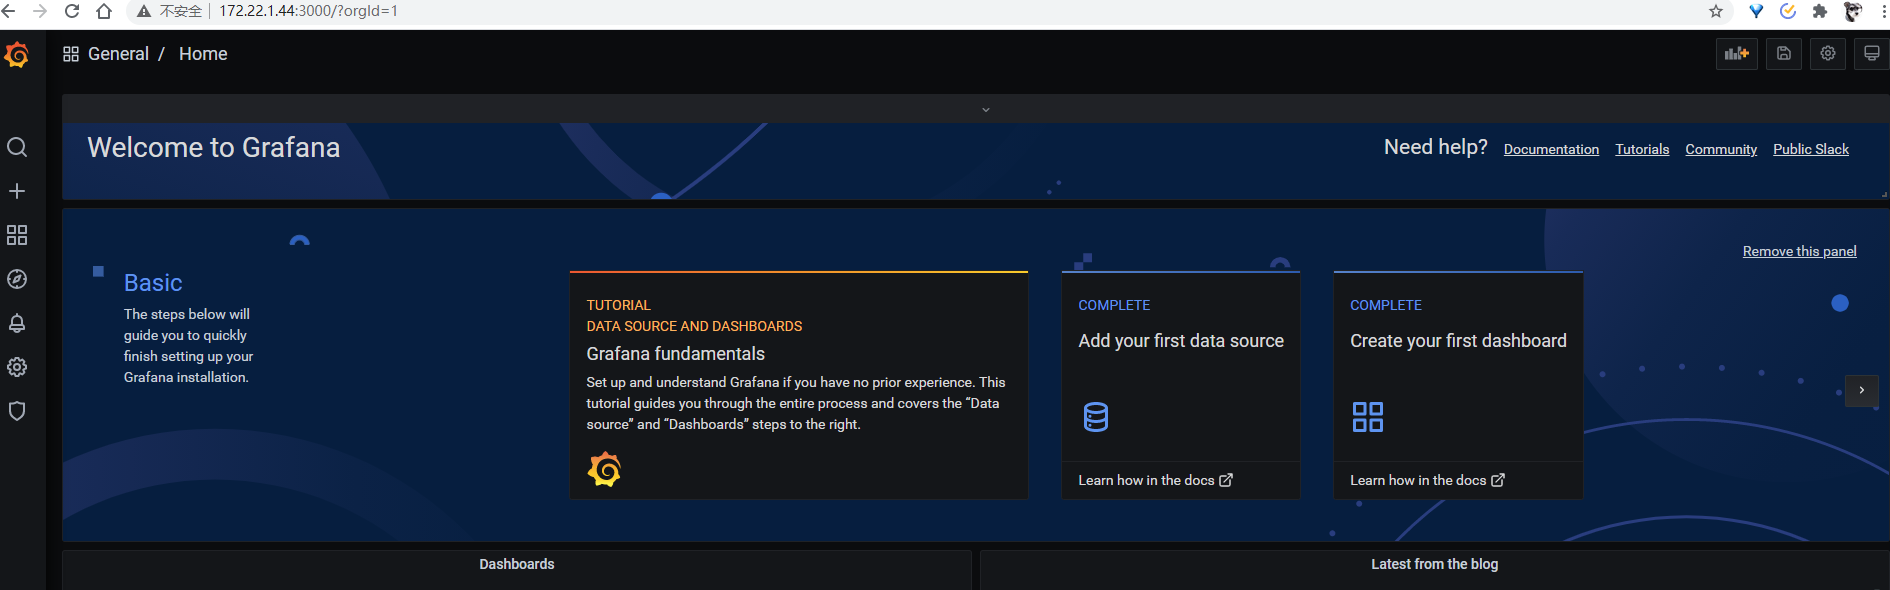
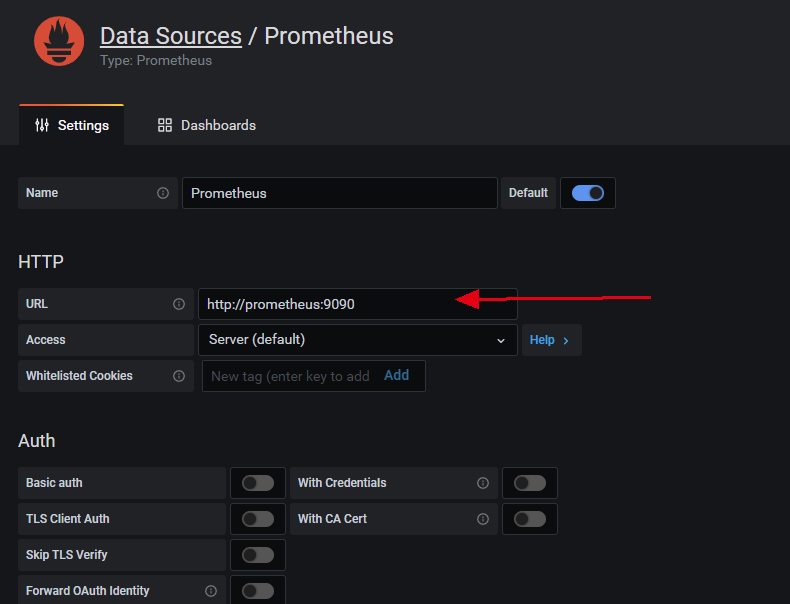
在grafana中添加数据源
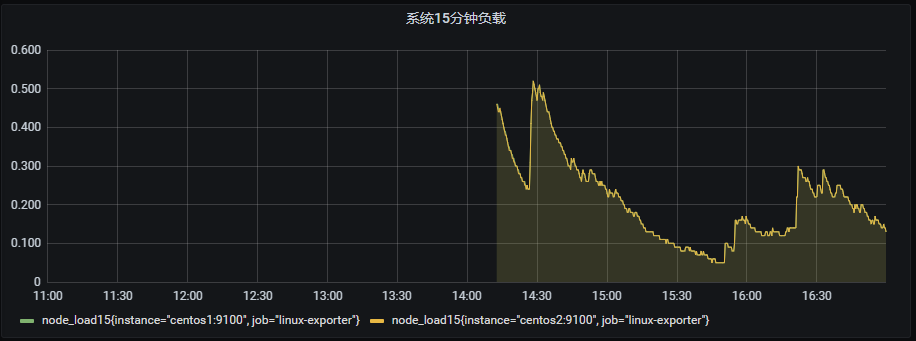
添加自定义node_exporter监控(系统负载)
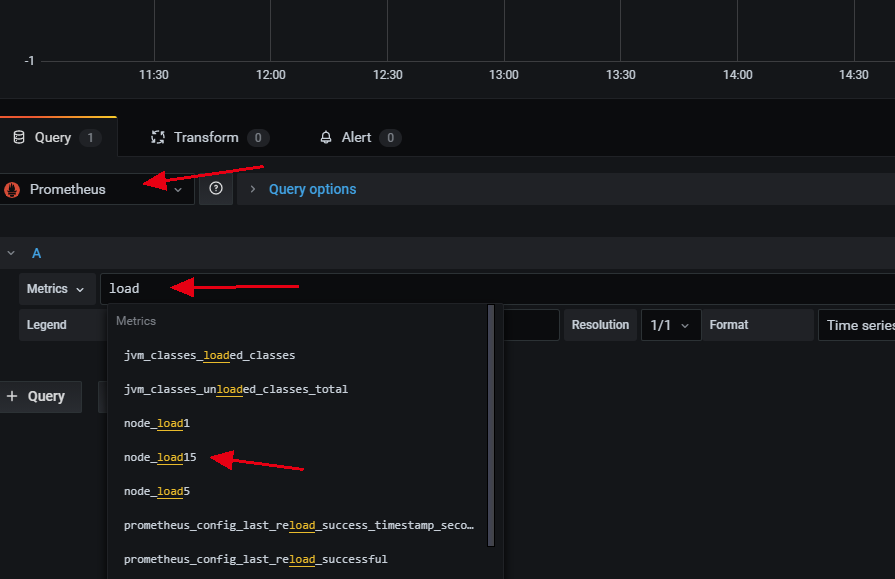
选择数据源和指标
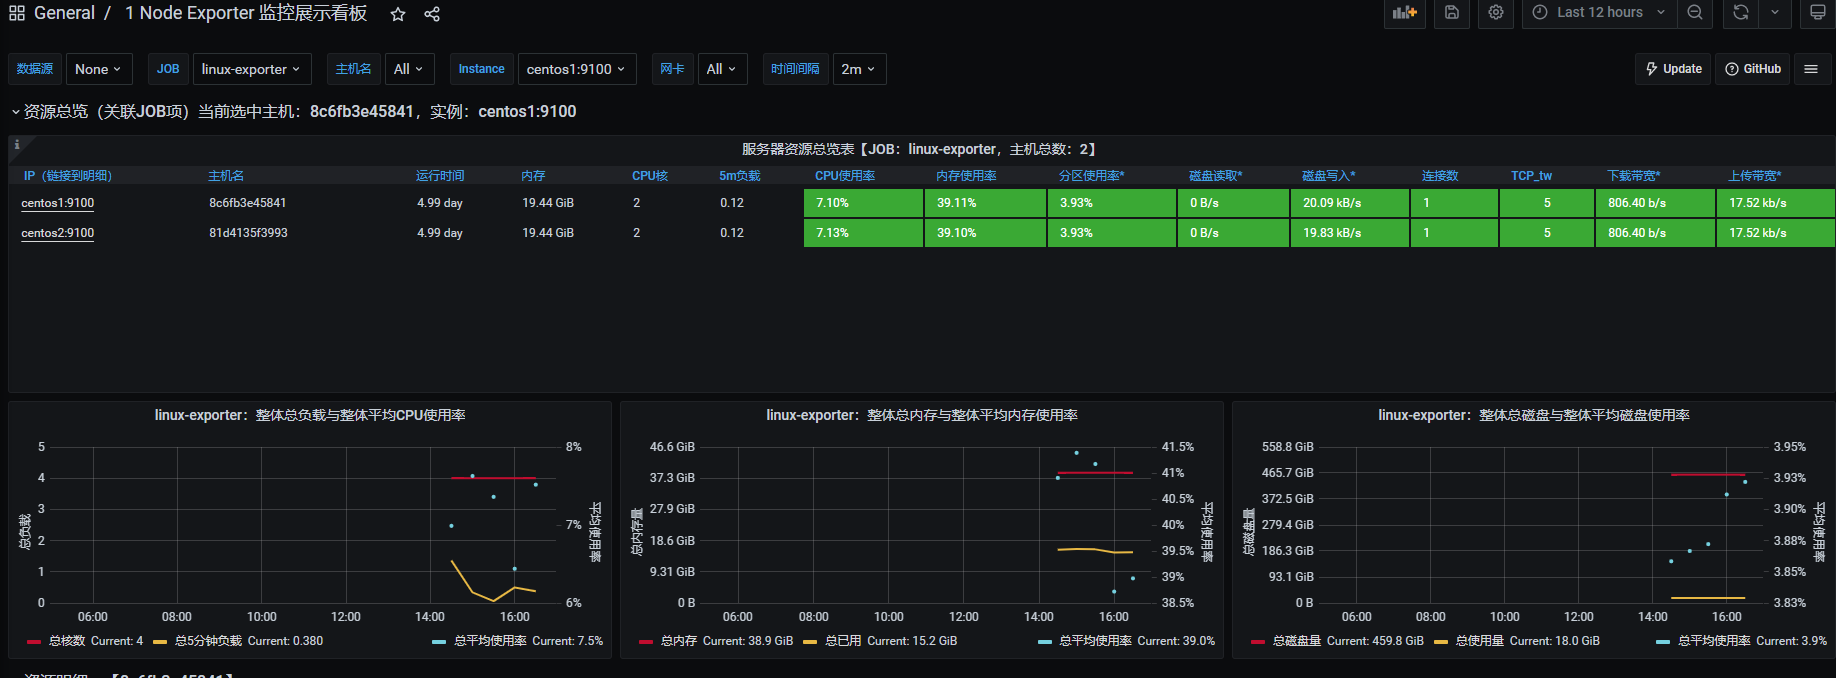
添加插件库 node_exporter监控
https://grafana.com/grafana/dashboards grafana 图标插件库
找到ID=8919的图标id
导入grafana中
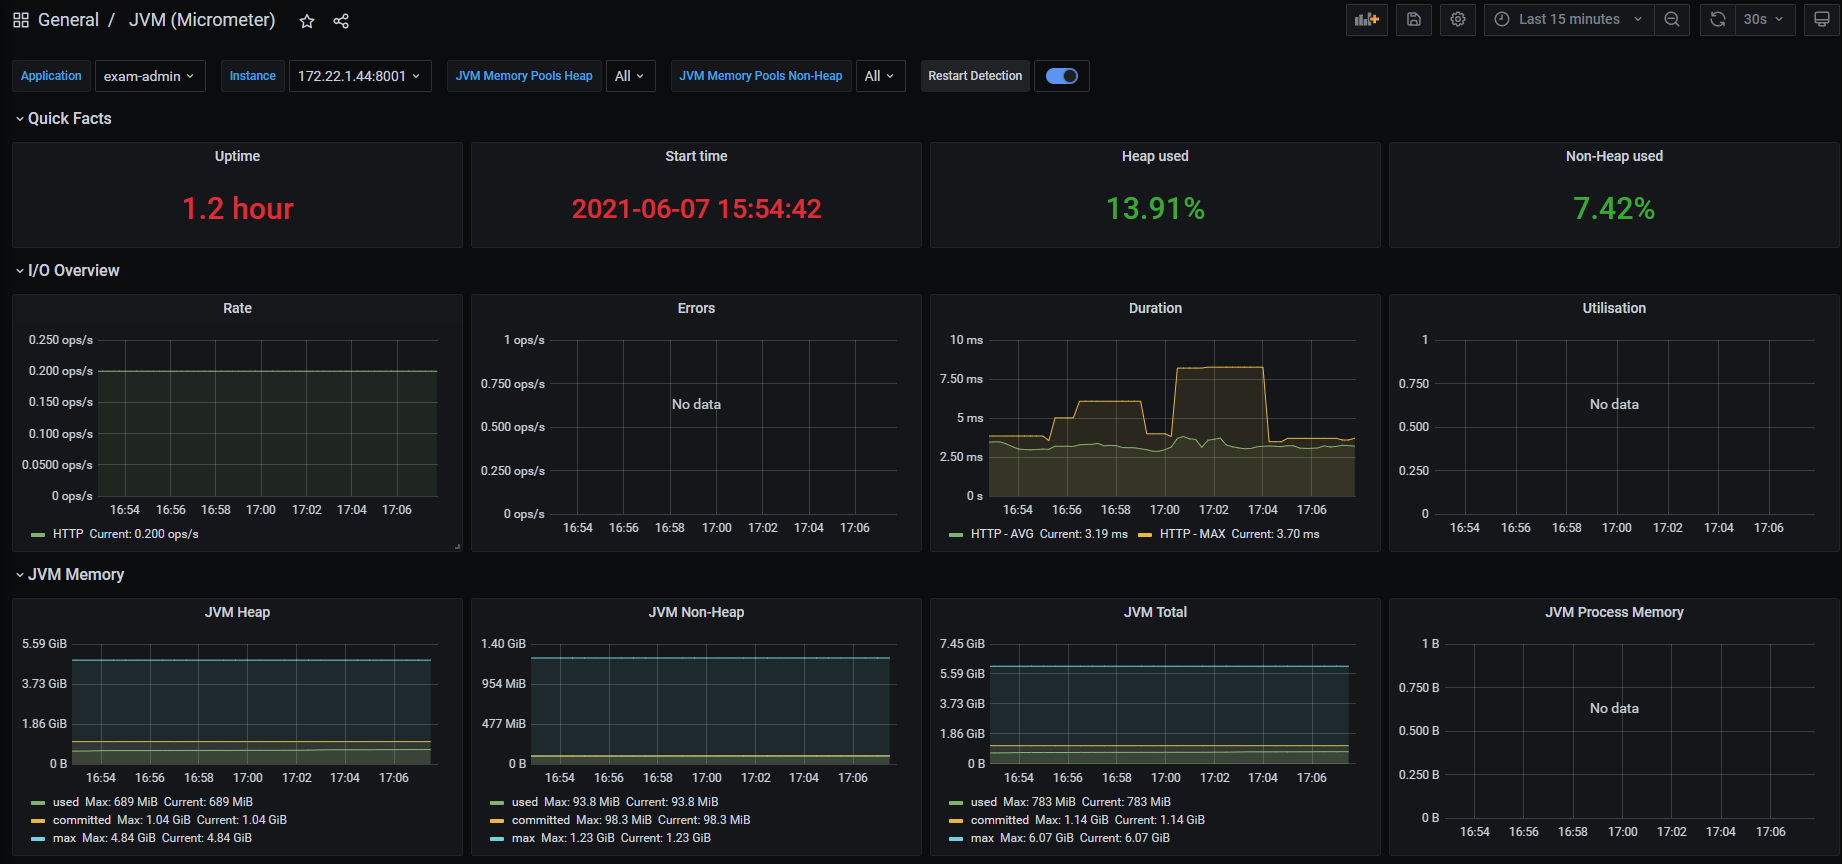
集成SpringBoot Actuator 监控信息
1
2
3
4
5
6
7
8
9
| <dependency>
<groupId>org.springframework.boot</groupId>
<artifactId>spring-boot-starter-actuator</artifactId>
</dependency>
<dependency>
<groupId>io.micrometer</groupId>
<artifactId>micrometer-registry-prometheus</artifactId>
</dependency>
|
1
2
3
4
5
6
7
8
9
10
11
| management:
endpoints:
web:
exposure:
include: '*'
endpoint:
health:
show-details: always
metrics:
tags:
application: exam-admin
|
1
2
3
4
| - job_name: 'actuator-exam-admin'
metrics_path: '/admin/actuator/prometheus'
static_configs:
- targets: ['172.22.1.44:8001']
|
导入插件id=4701
注意选中prometheus数据源
参考